
💻 Statistics
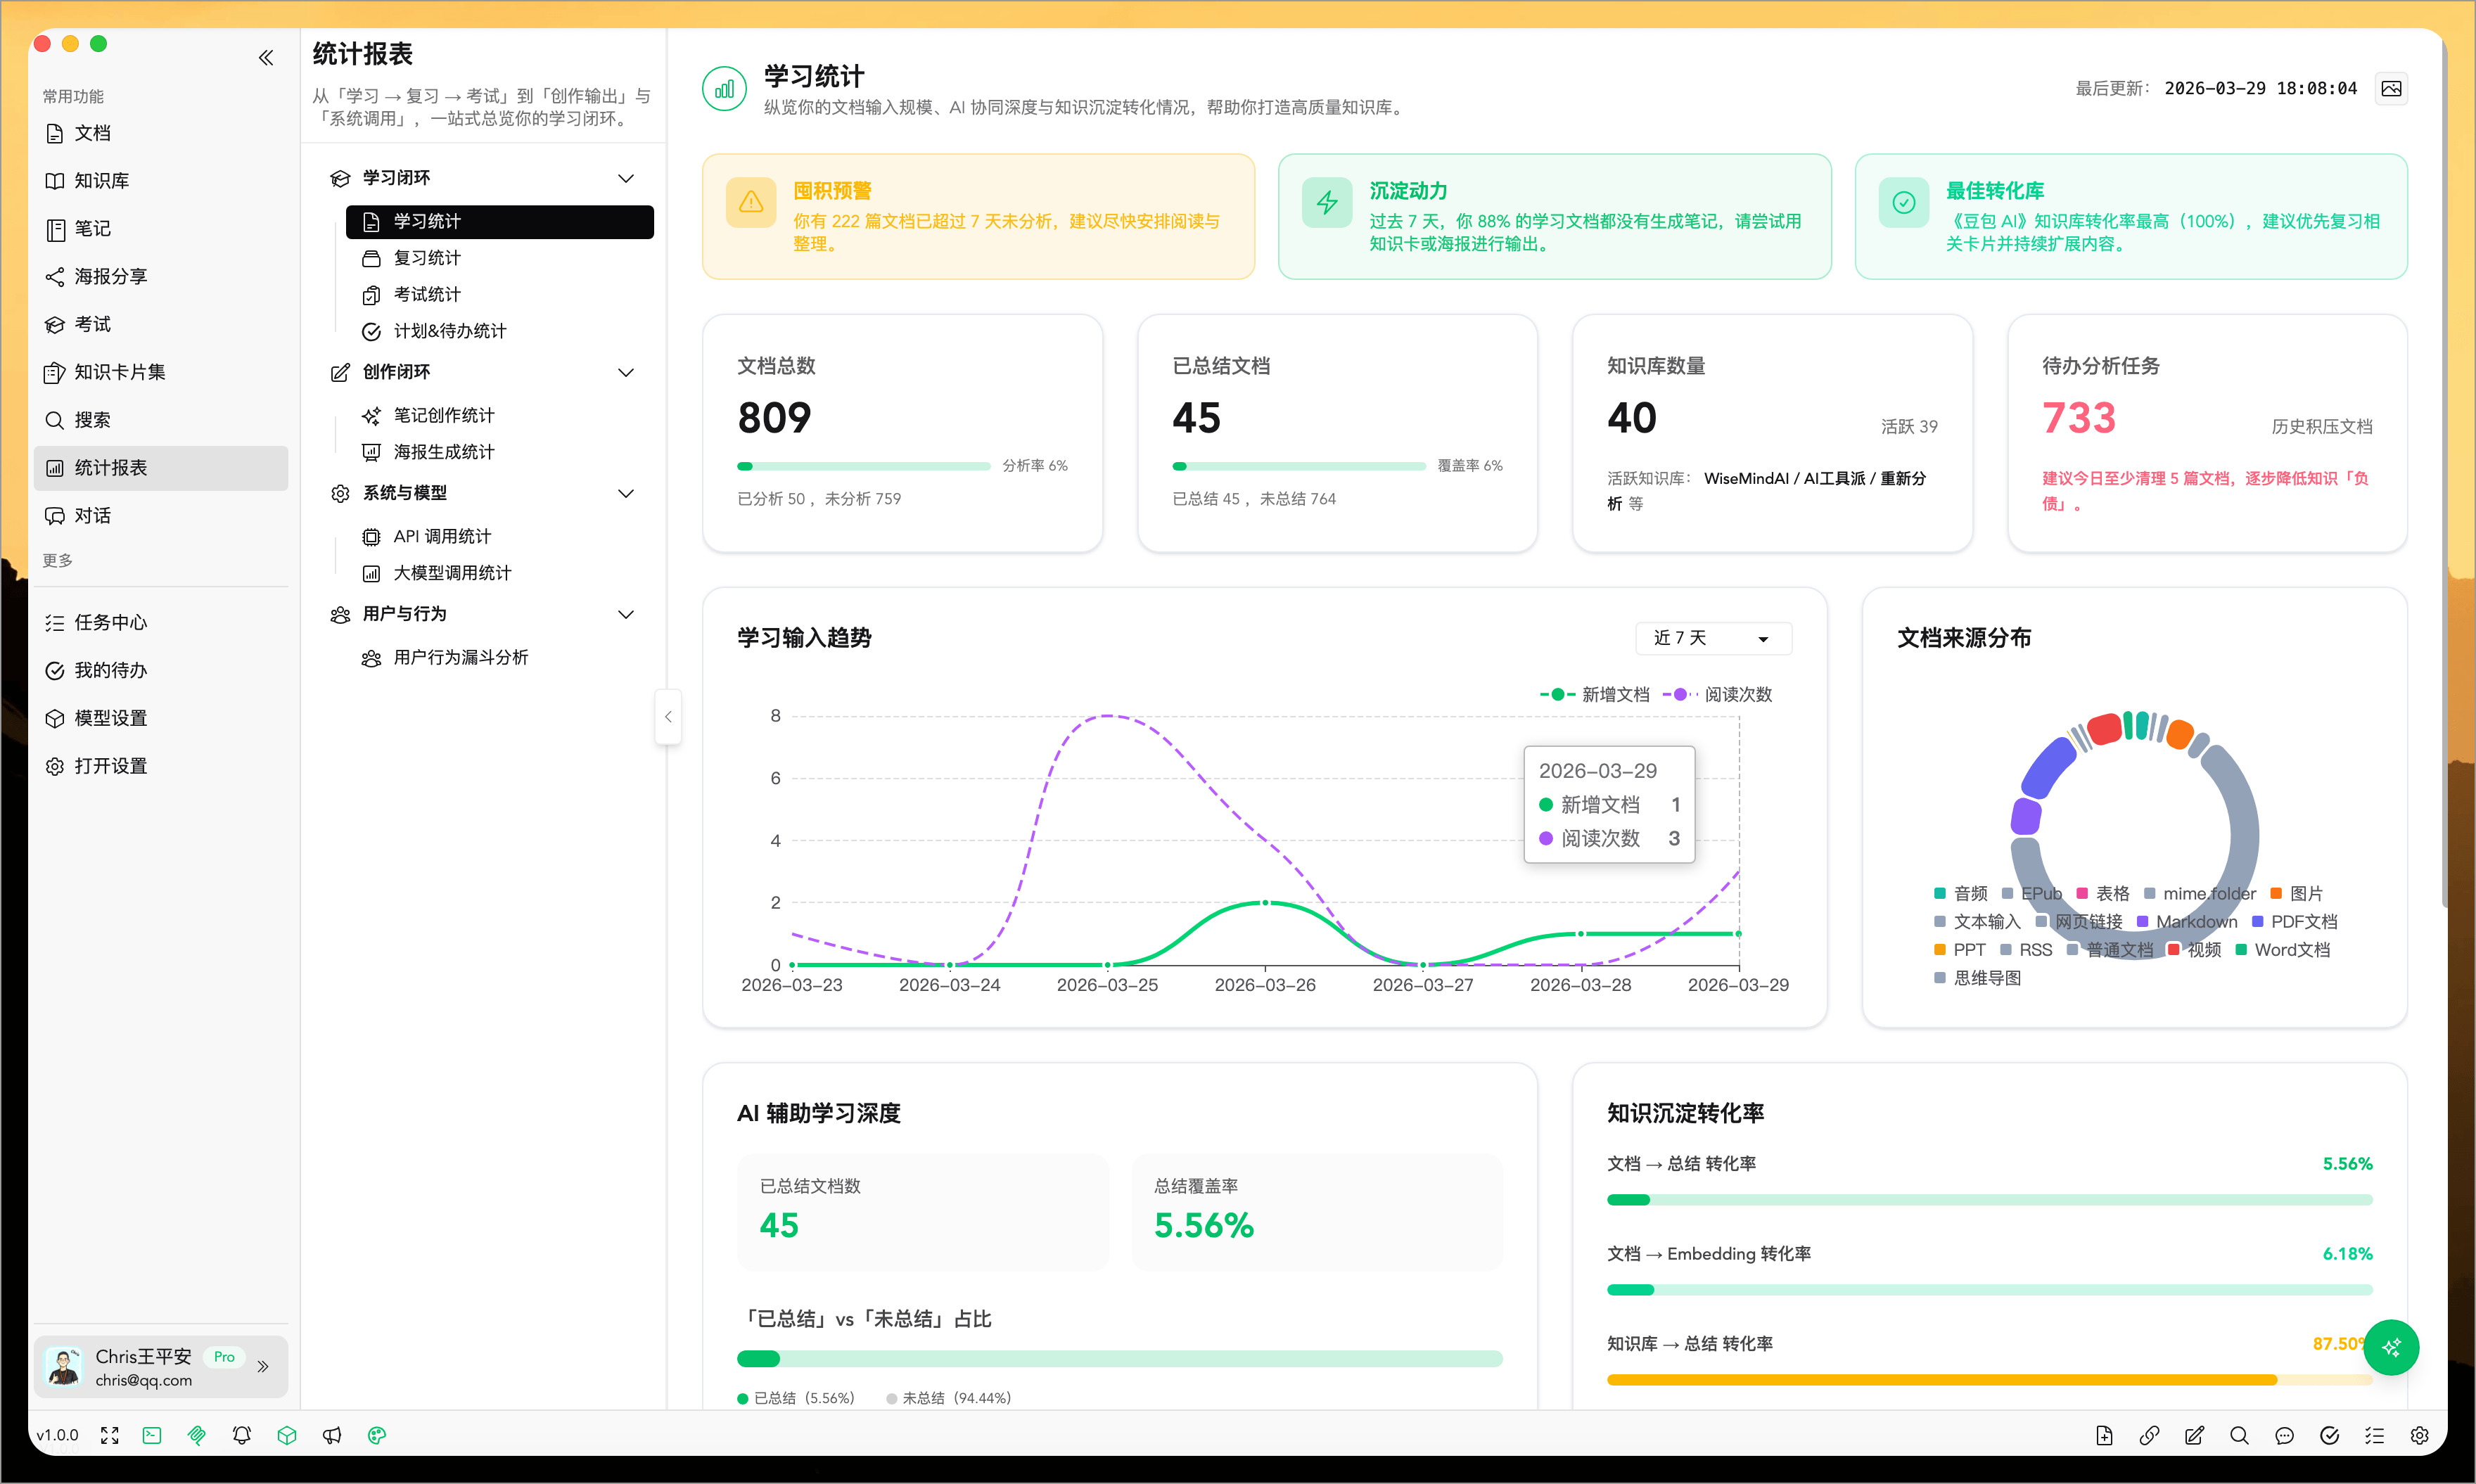
The WiseMindAI statistics panel provides a comprehensive analysis of your learning input, review sessions, exam results, note output, and poster generation. It helps you quickly understand how well you are doing across these key areas.
💡 What You Can See
Through charts and numbers, you can instantly see:
- How much content you've learned recently
- Whether your review consistency is stable
- Your exam performance results
- If note-taking and poster output are ongoing
- Which areas need improvement
📚 Main Statistics Modules
1. Learning Statistics
Focuses on documents, the knowledge base, and learning input metrics:
- Total document count
- Summarized document count
- Knowledge base quantity
- Pending tasks
- Learning input trends
The system also provides simple reminders based on your usage patterns, such as storage warnings or study suggestions.
2. Review Statistics
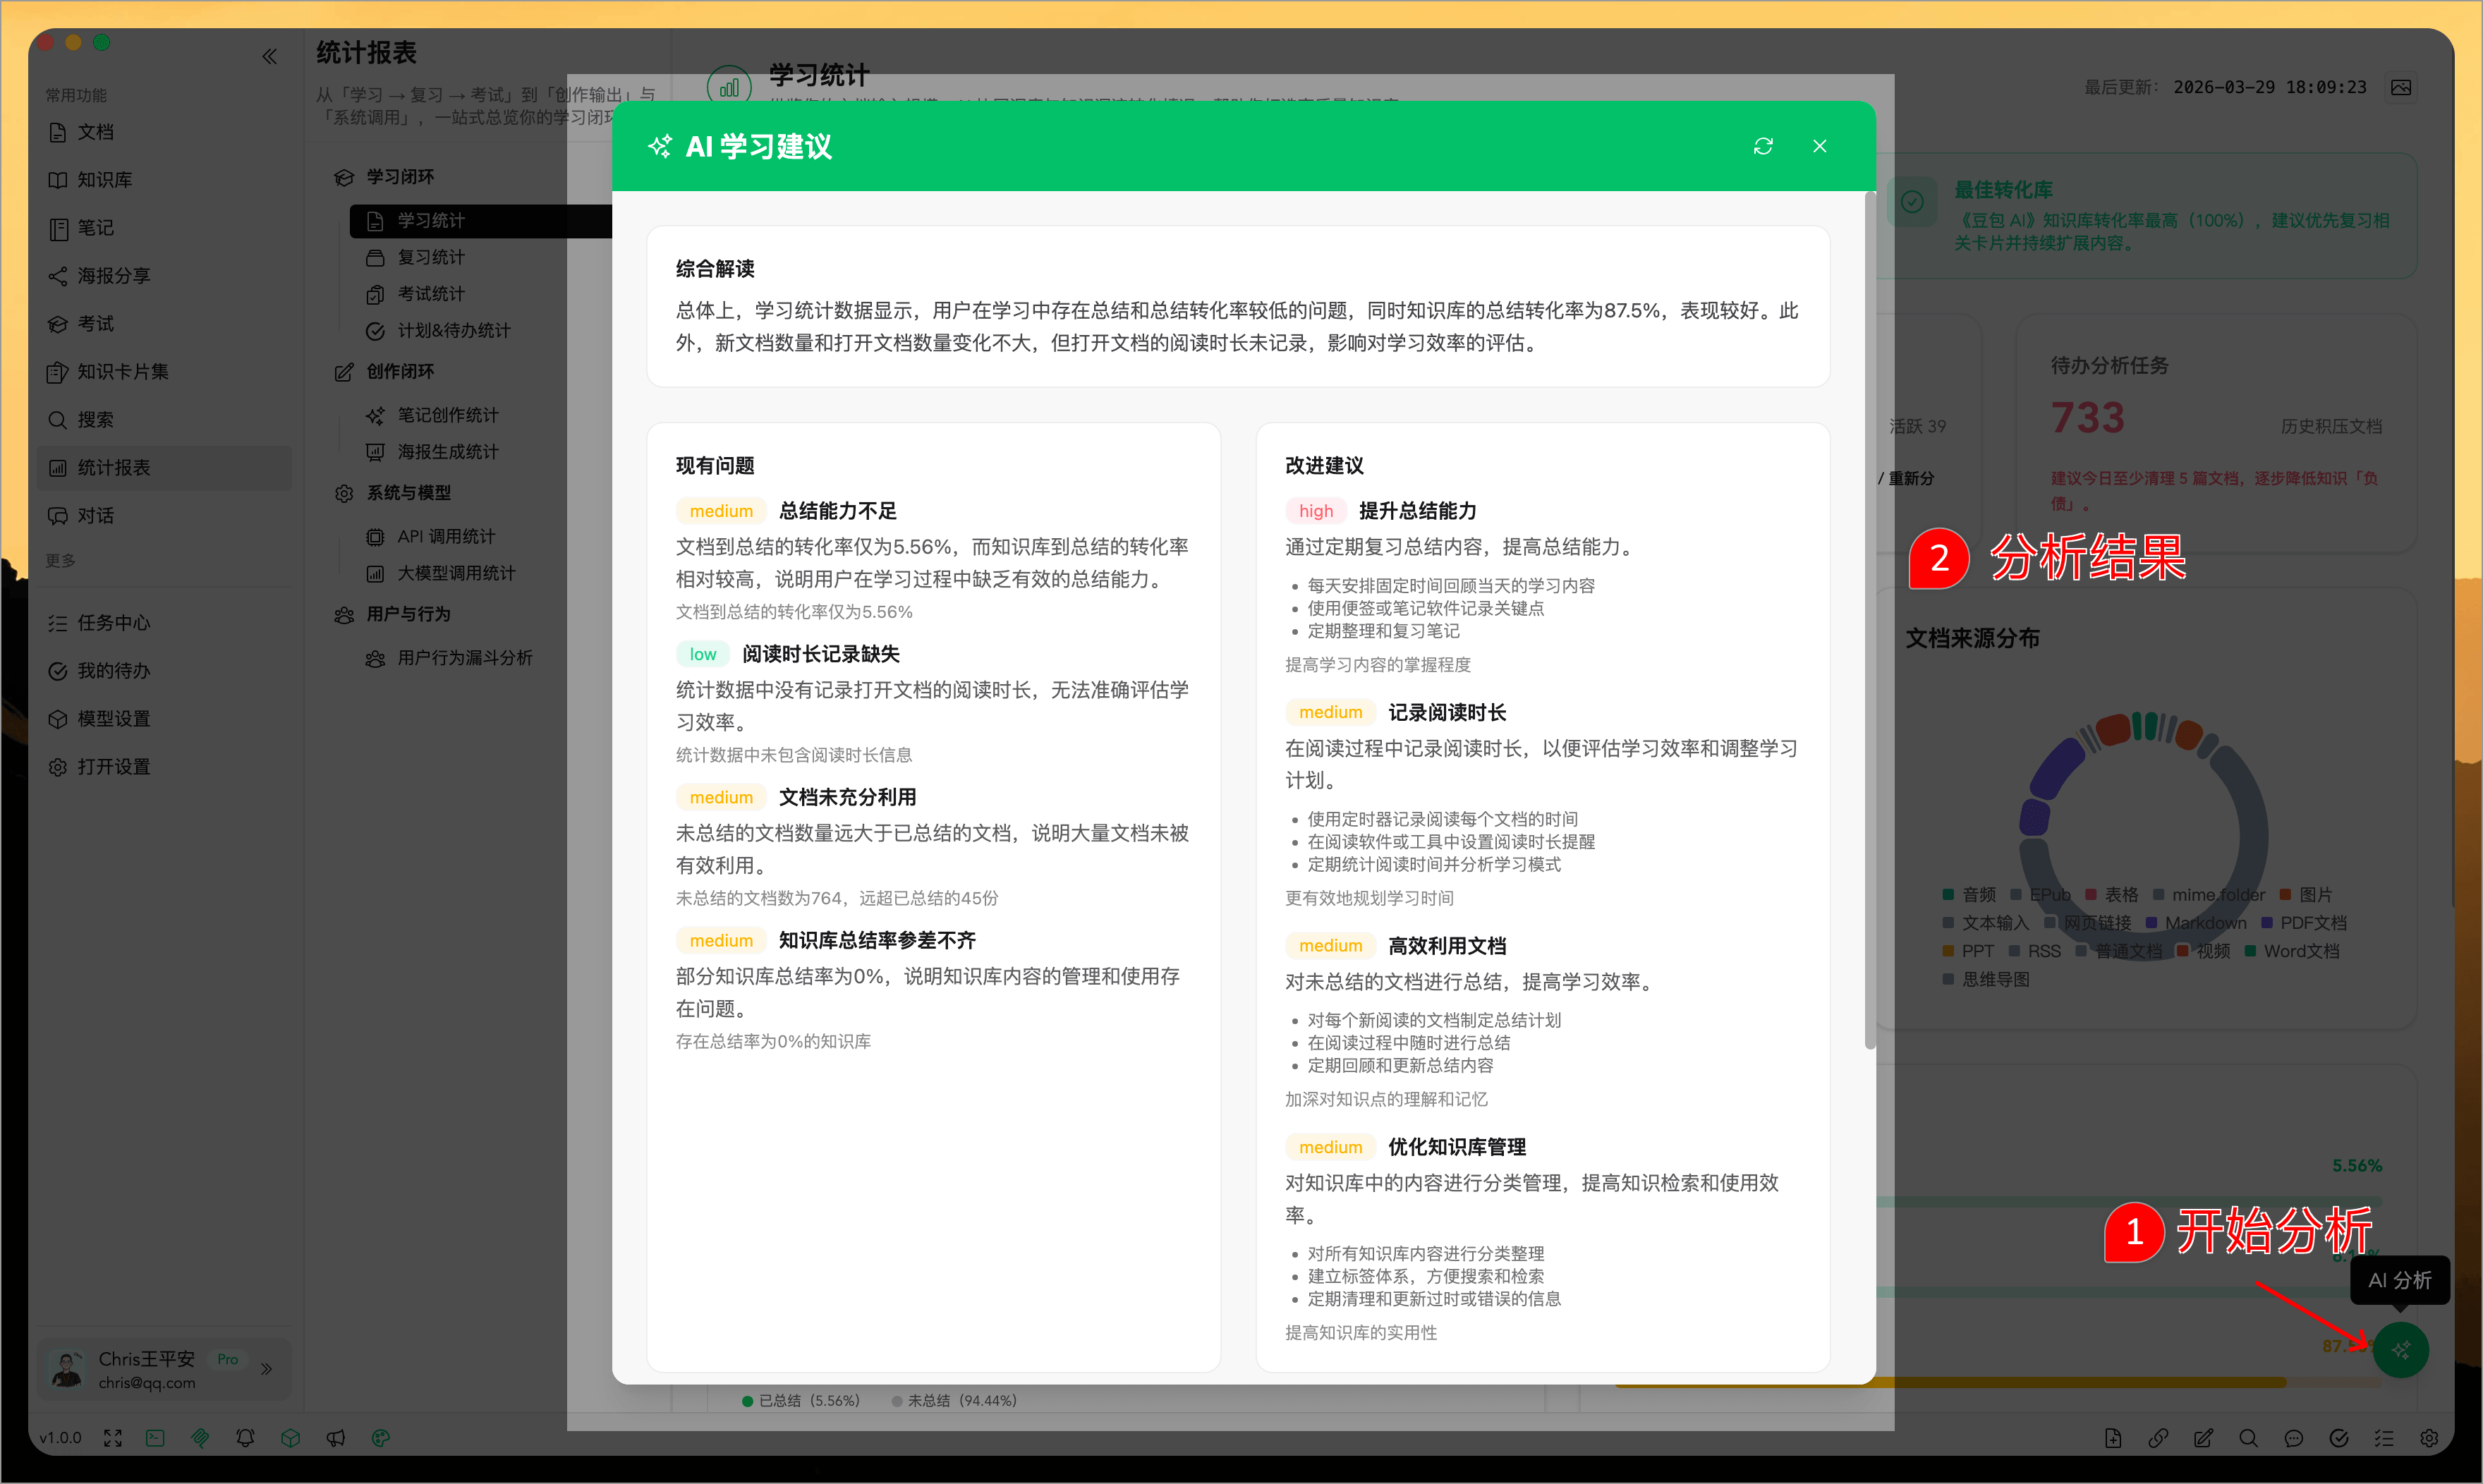
Focuses on knowledge card review progress:
- Daily review count
- Weekly review count
- Total deck size
- Total cards
- Distribution of remembered, fuzzy recall, and forgotten states
- High-frequency forgotten cards
This page is ideal for assessing whether your review rhythm remains consistent.
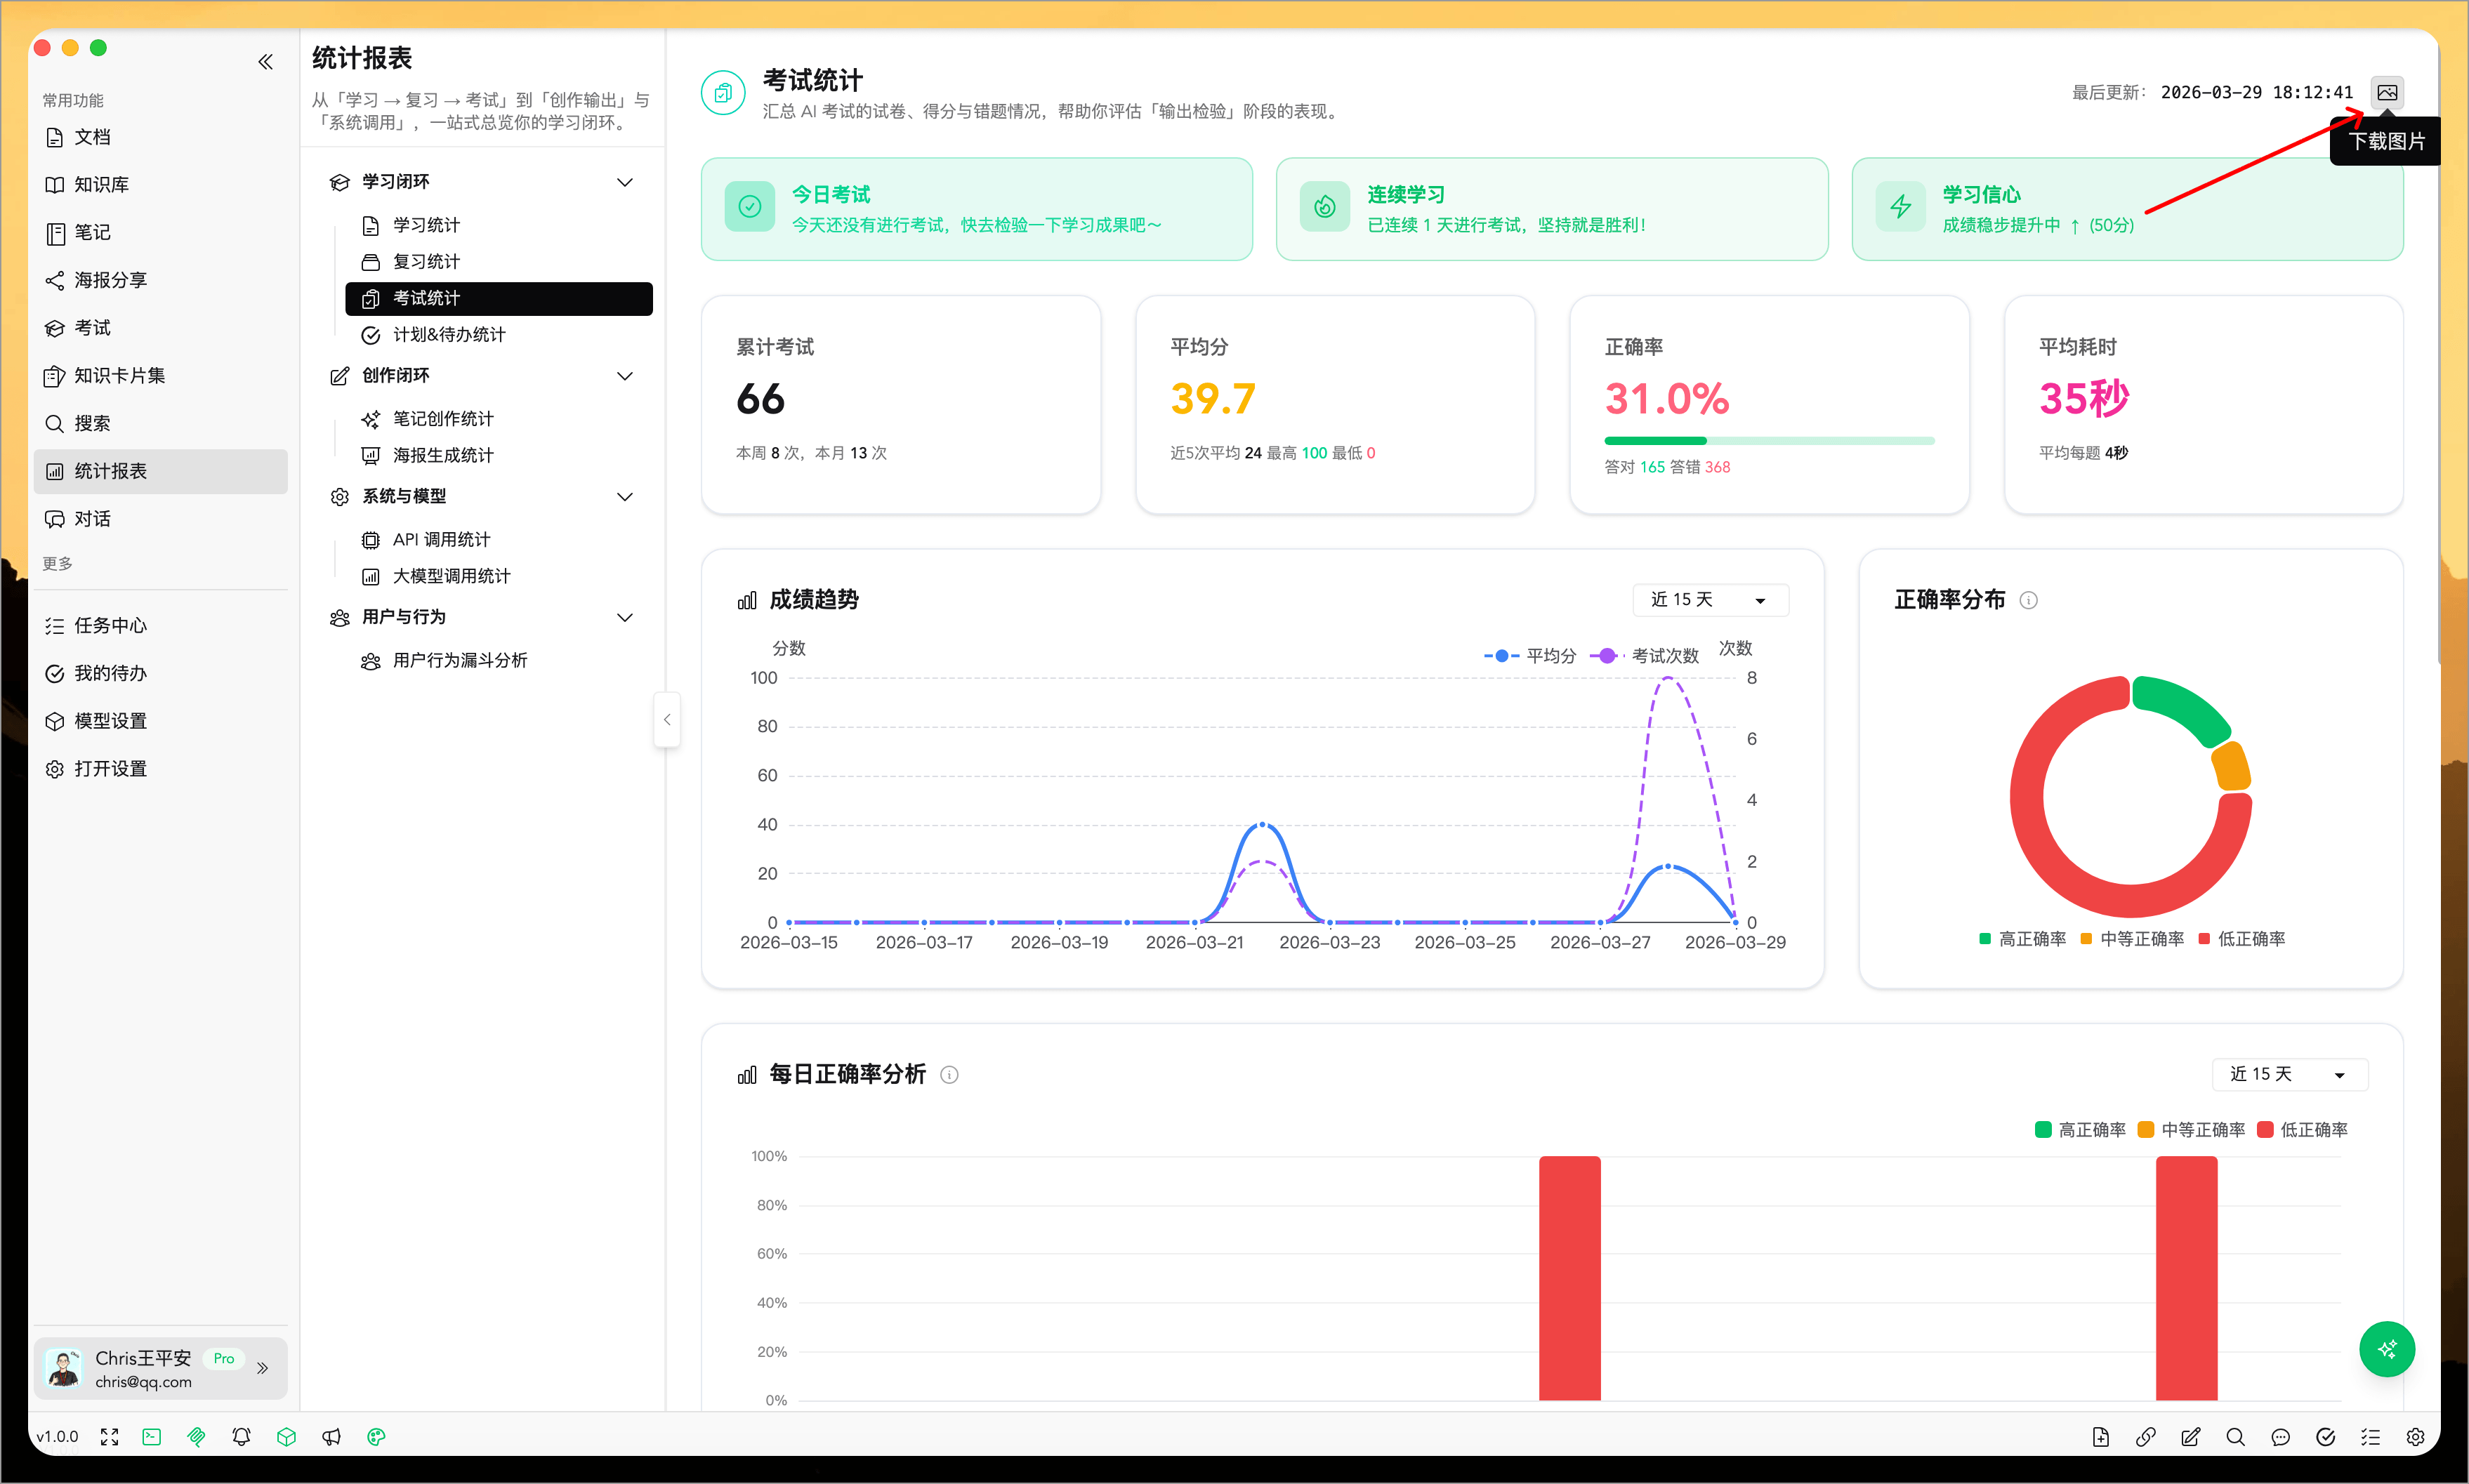
3. Exam Statistics
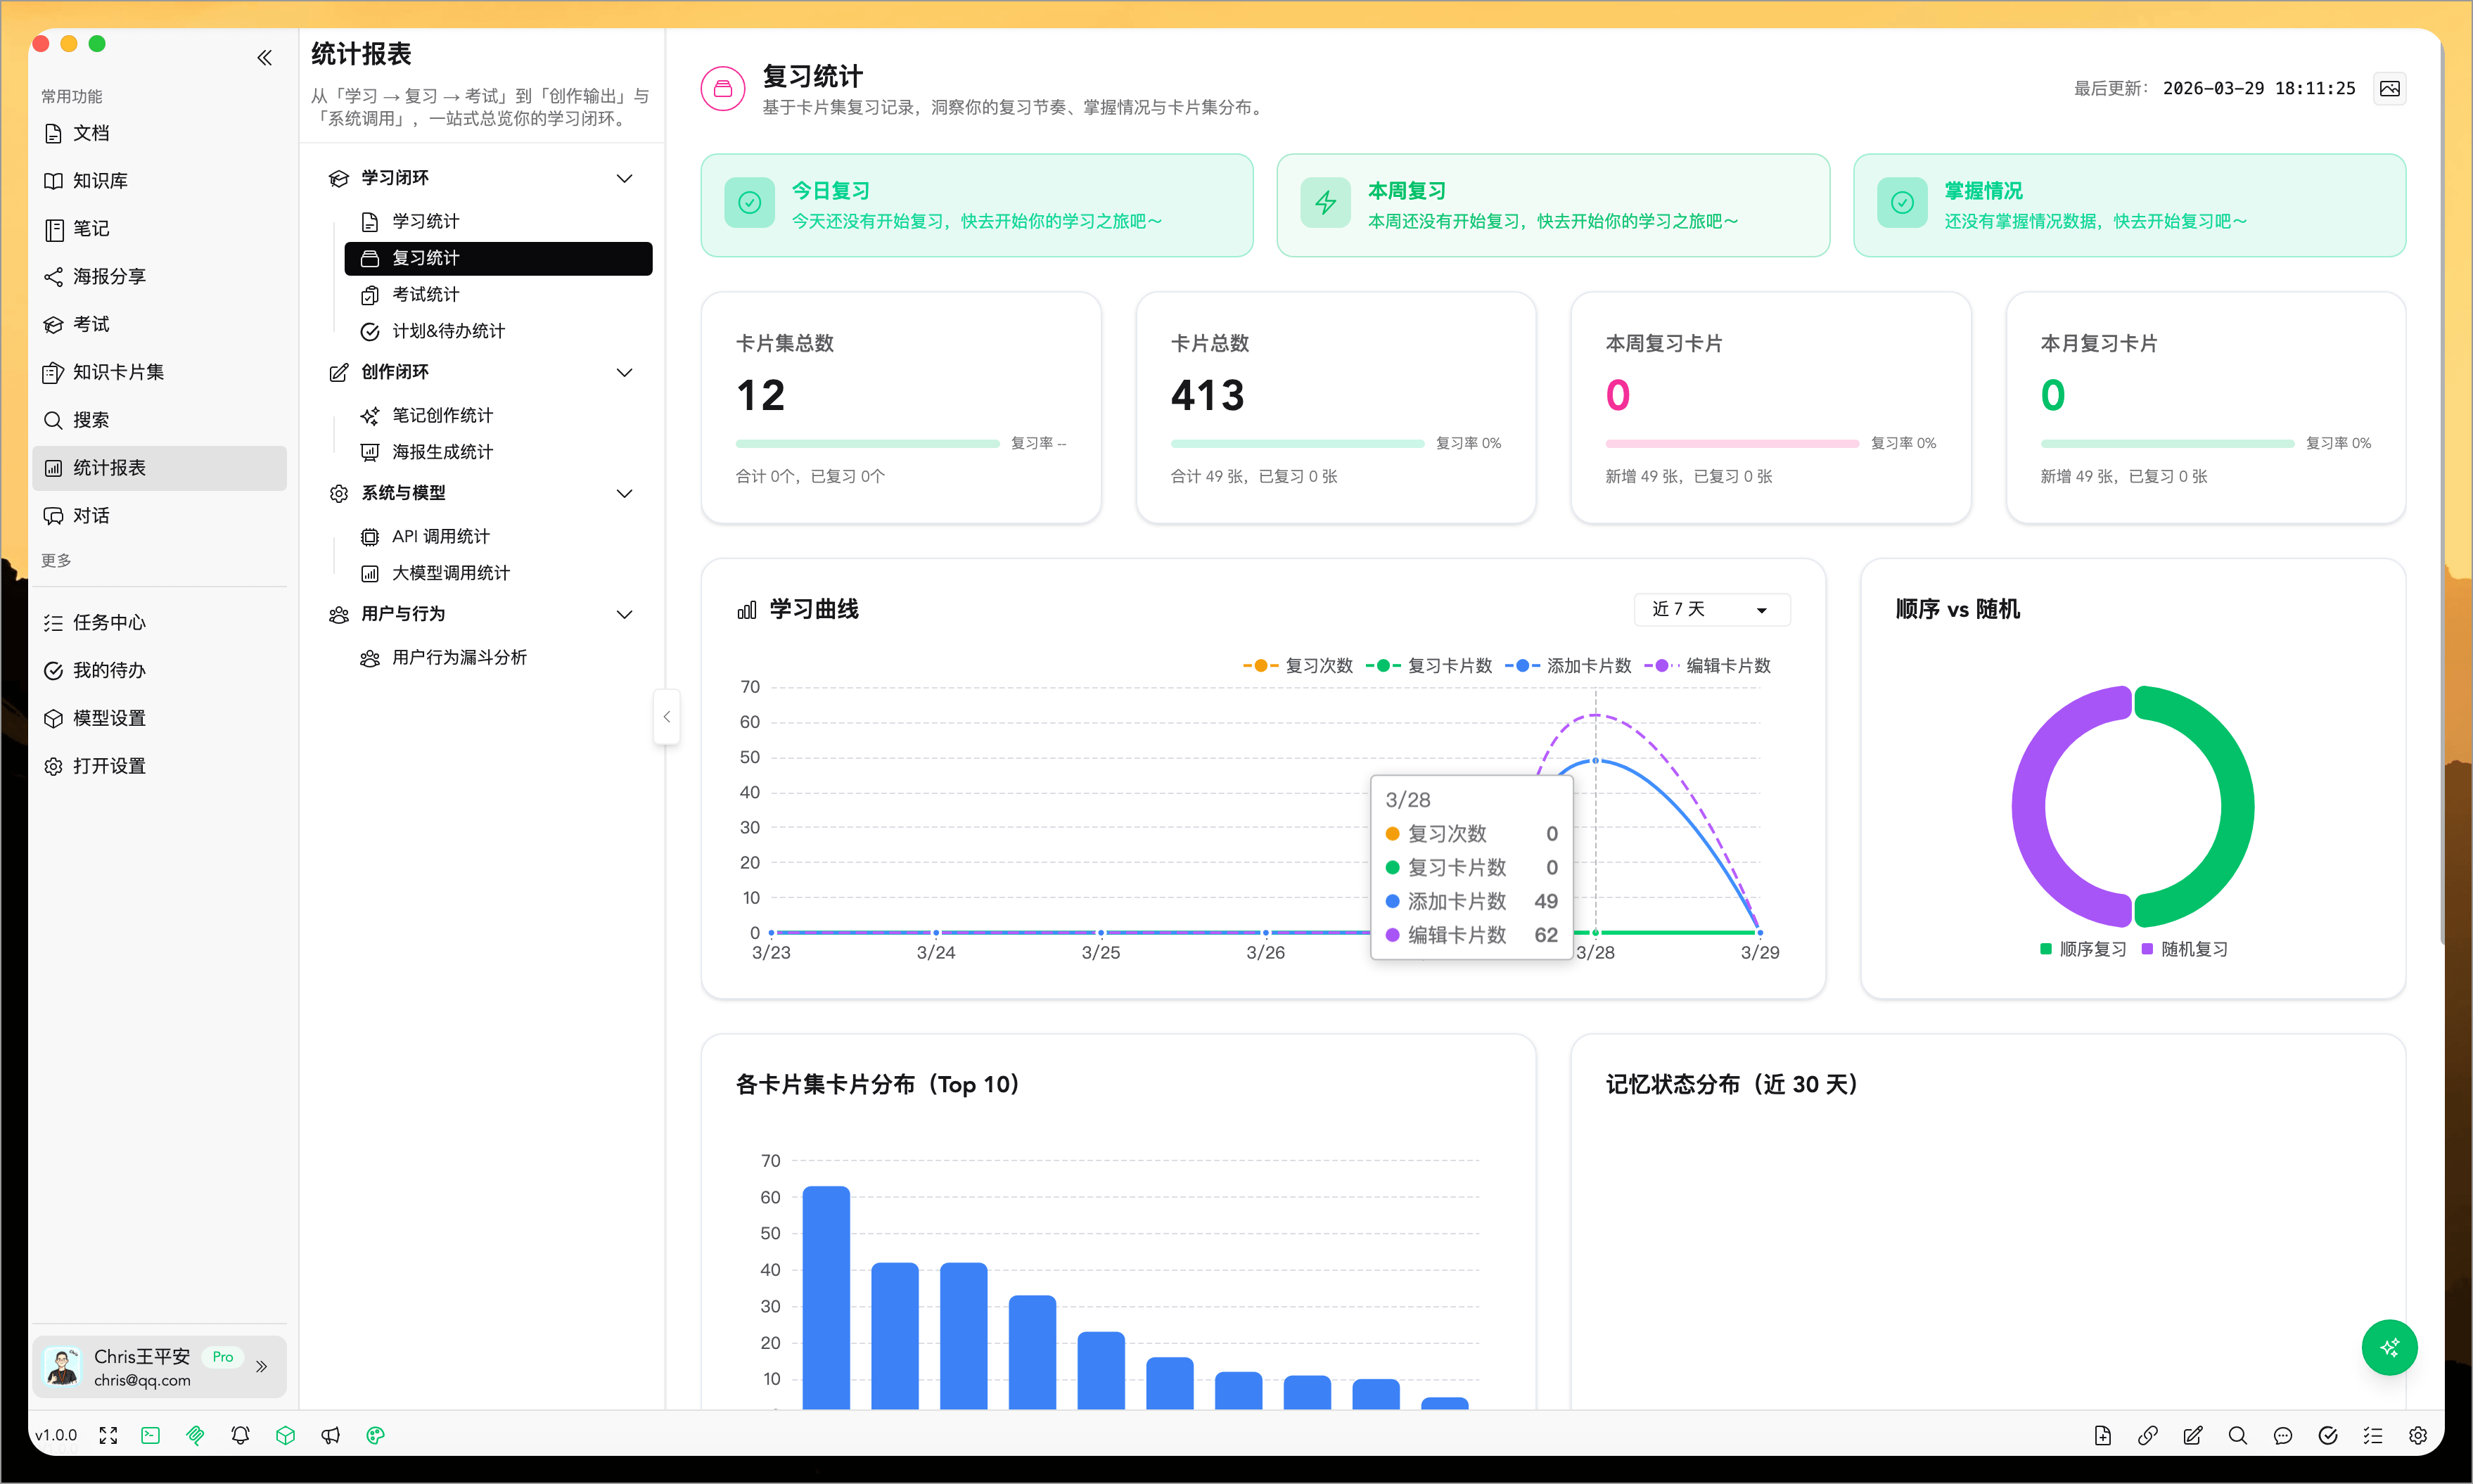
Focuses on exam results and mastery levels:
- Total number of exams taken
- Average score
- Accuracy rate
- Average time spent per question
- Score trends over time
- Sources of frequent errors
If you frequently use AI for testing, this page offers an intuitive overview of your learning effectiveness.
4. Note Creation Statistics
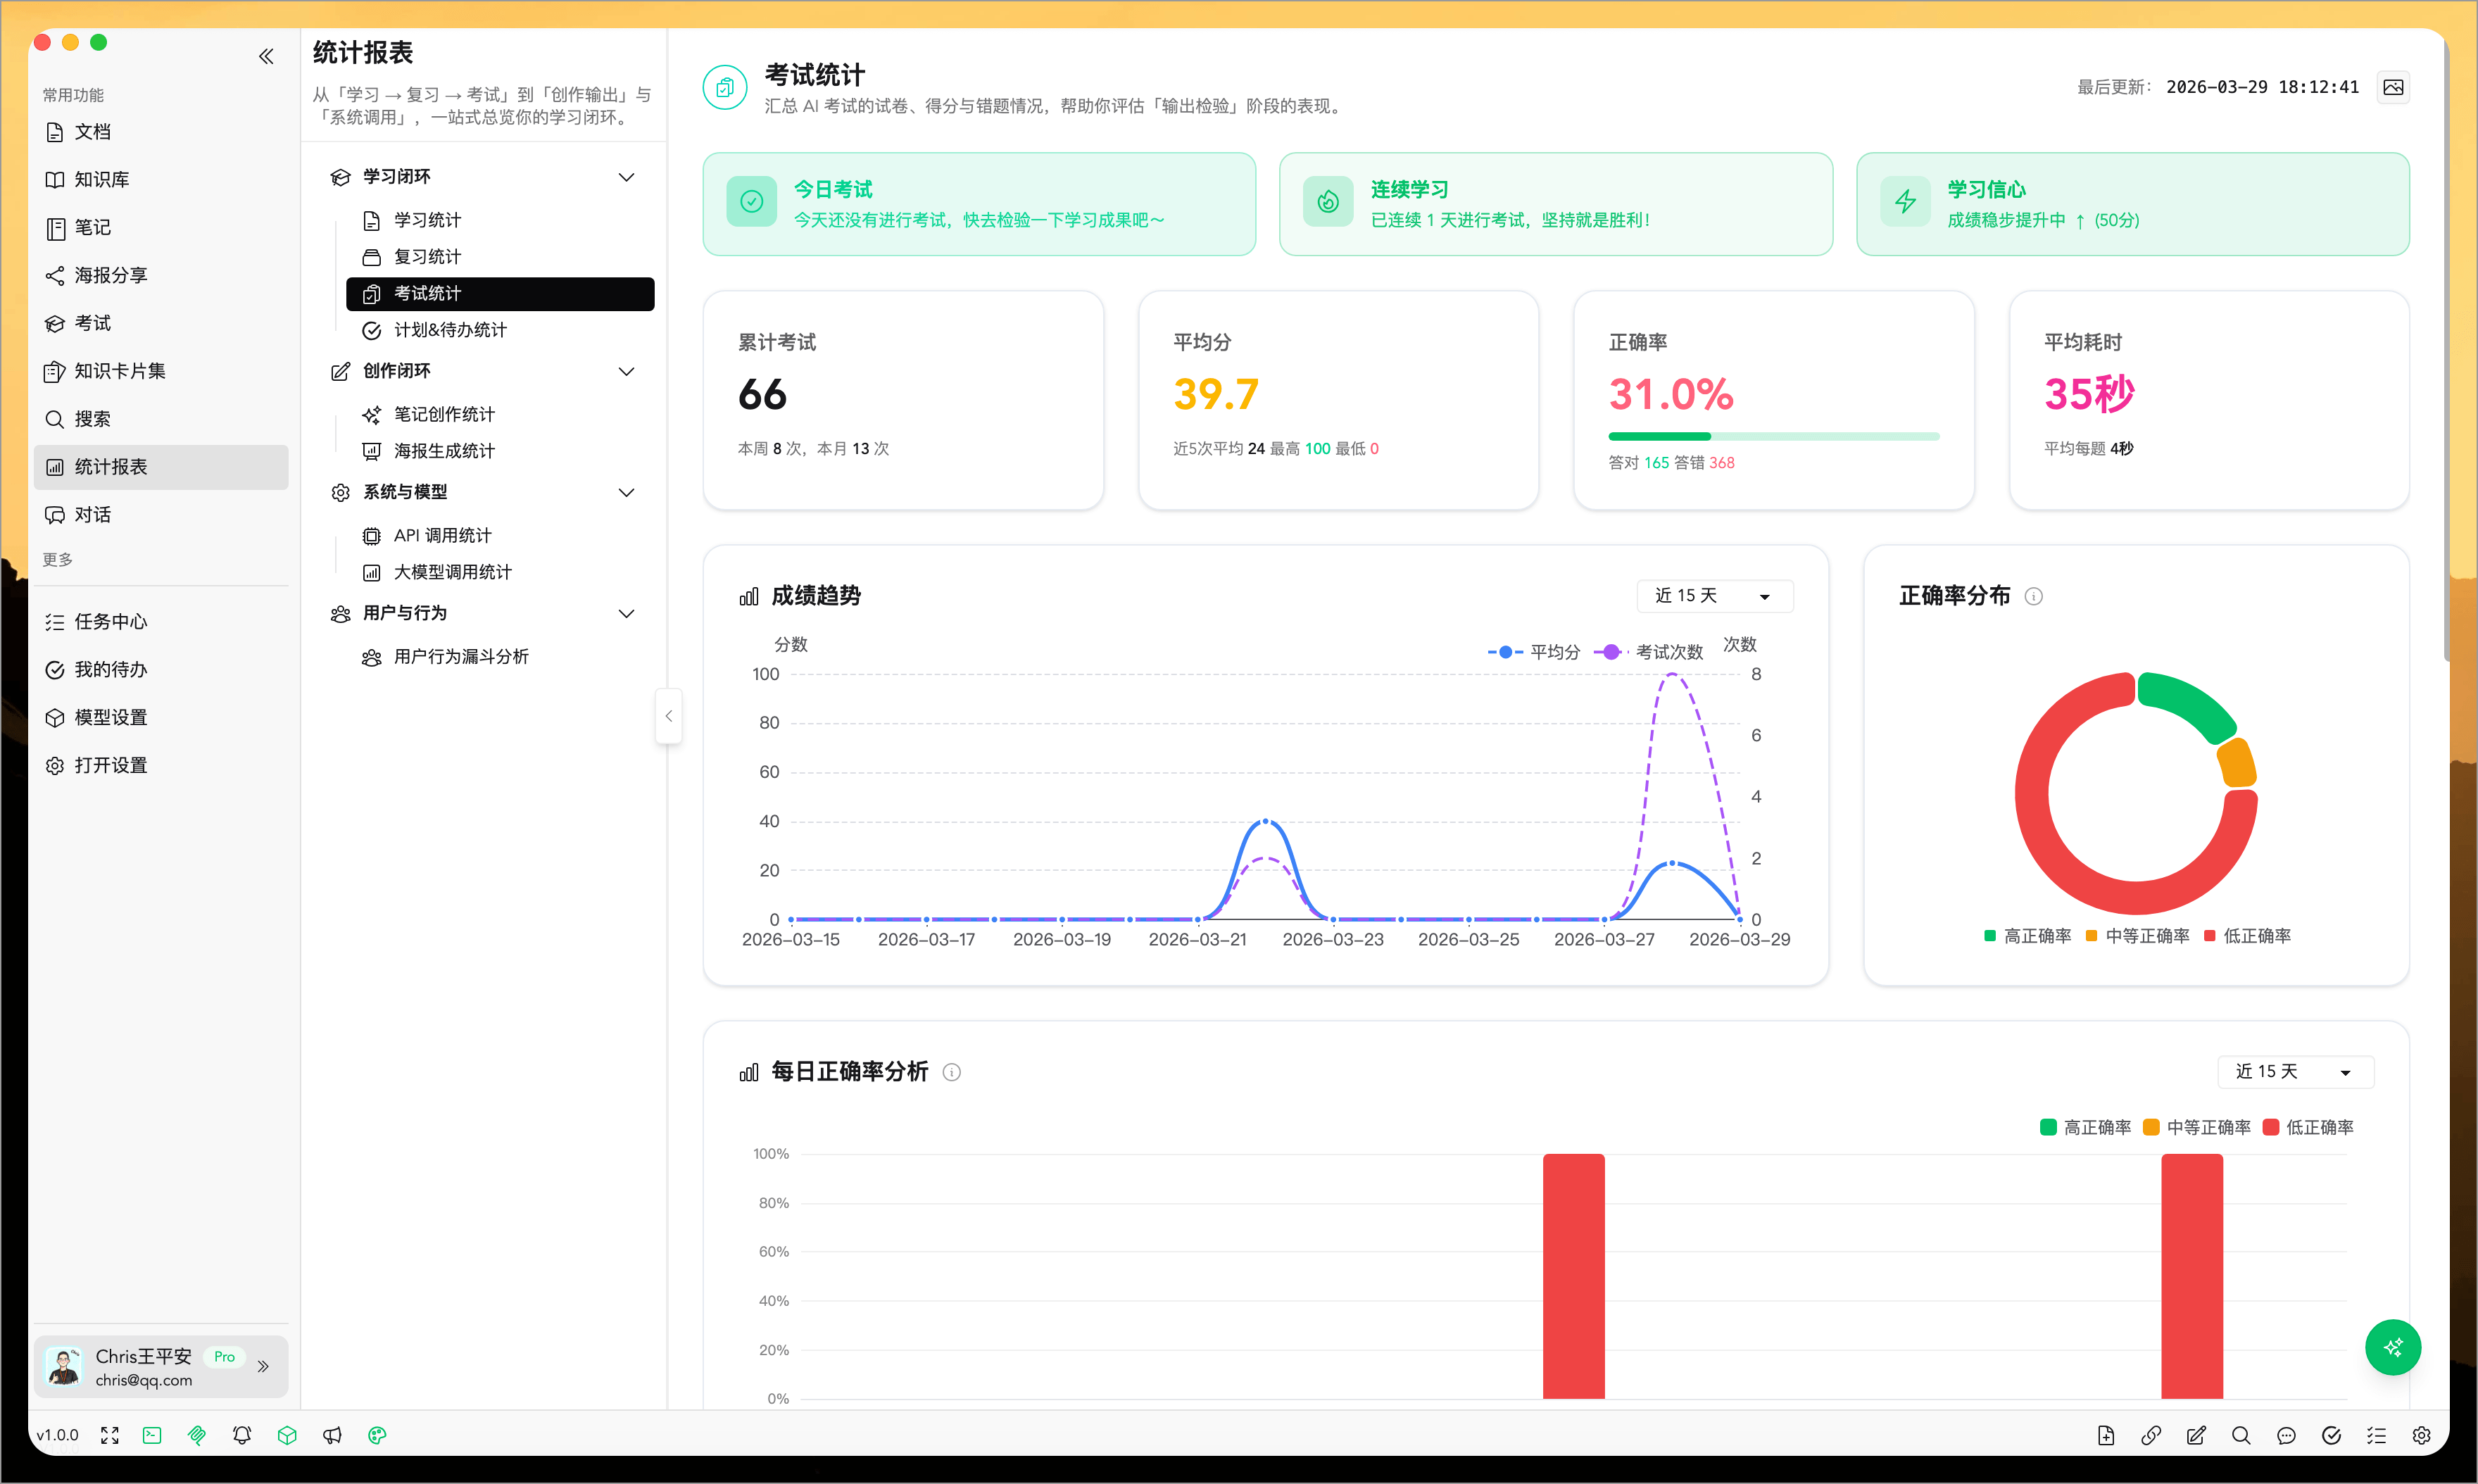
Focuses on knowledge output metrics:
- Total note count
- Recently added notes
- Average word count per note
- Popular tags
- Creation trends over time
- Distribution of note sources
This helps determine if you are consistently producing content rather than just consuming input.
5. Poster Generation Statistics
Focuses on visual output metrics:
- Total poster count
- Daily generation count
- Weekly generation count
- Time of most recent generation
- Generation trends over time
📤 Exporting Statistics
The statistics pages support exporting as images for easy saving and sharing.
Export Steps
- Open any statistics page
- Click the export button in the top-right corner
- Select your save location
- Wait for the system to generate the image
Permissions
- Pro Users: Full access to all export features
- Free Users: Export functionality is limited
🌈 Recommended Usage
Review Learning Statistics weekly
Great for quickly checking if you've maintained consistent input and processed materials this week.Check Review Statistics regularly
Ideal for verifying the stability of your knowledge card reviews and identifying content that tends to be forgotten most often.View Exam Statistics immediately after taking an exam
Perfect for evaluating recent learning performance and pinpointing weak areas.Combine Note and Poster Statistics with output metrics
Helps determine if you are effectively converting input into tangible notes, posters, or other deliverables.
❓ FAQ
Q: How often is data updated? A: Data refreshes automatically when you open the page. It also recalculates after switching time ranges.
Q: Why do some statistics show 0? A: This usually occurs because a feature hasn't been used yet, or there are no records within your selected timeframe for that metric.
Q: Can I export as PDF? A: Currently, image exports are the primary supported format.
Q: Can free users view statistics? A: Yes, you can access all statistical data; however, export features have limitations on the free plan.